
Data distilled down into the perfect dojo.
As an economist working in the data sciences industry, you understand the importance of analyzing and interpreting vast amounts of data to make informed business decisions. However, with so much data available, it can be challenging to keep track of everything and make sense of it all. This is where a dashboard comes in.

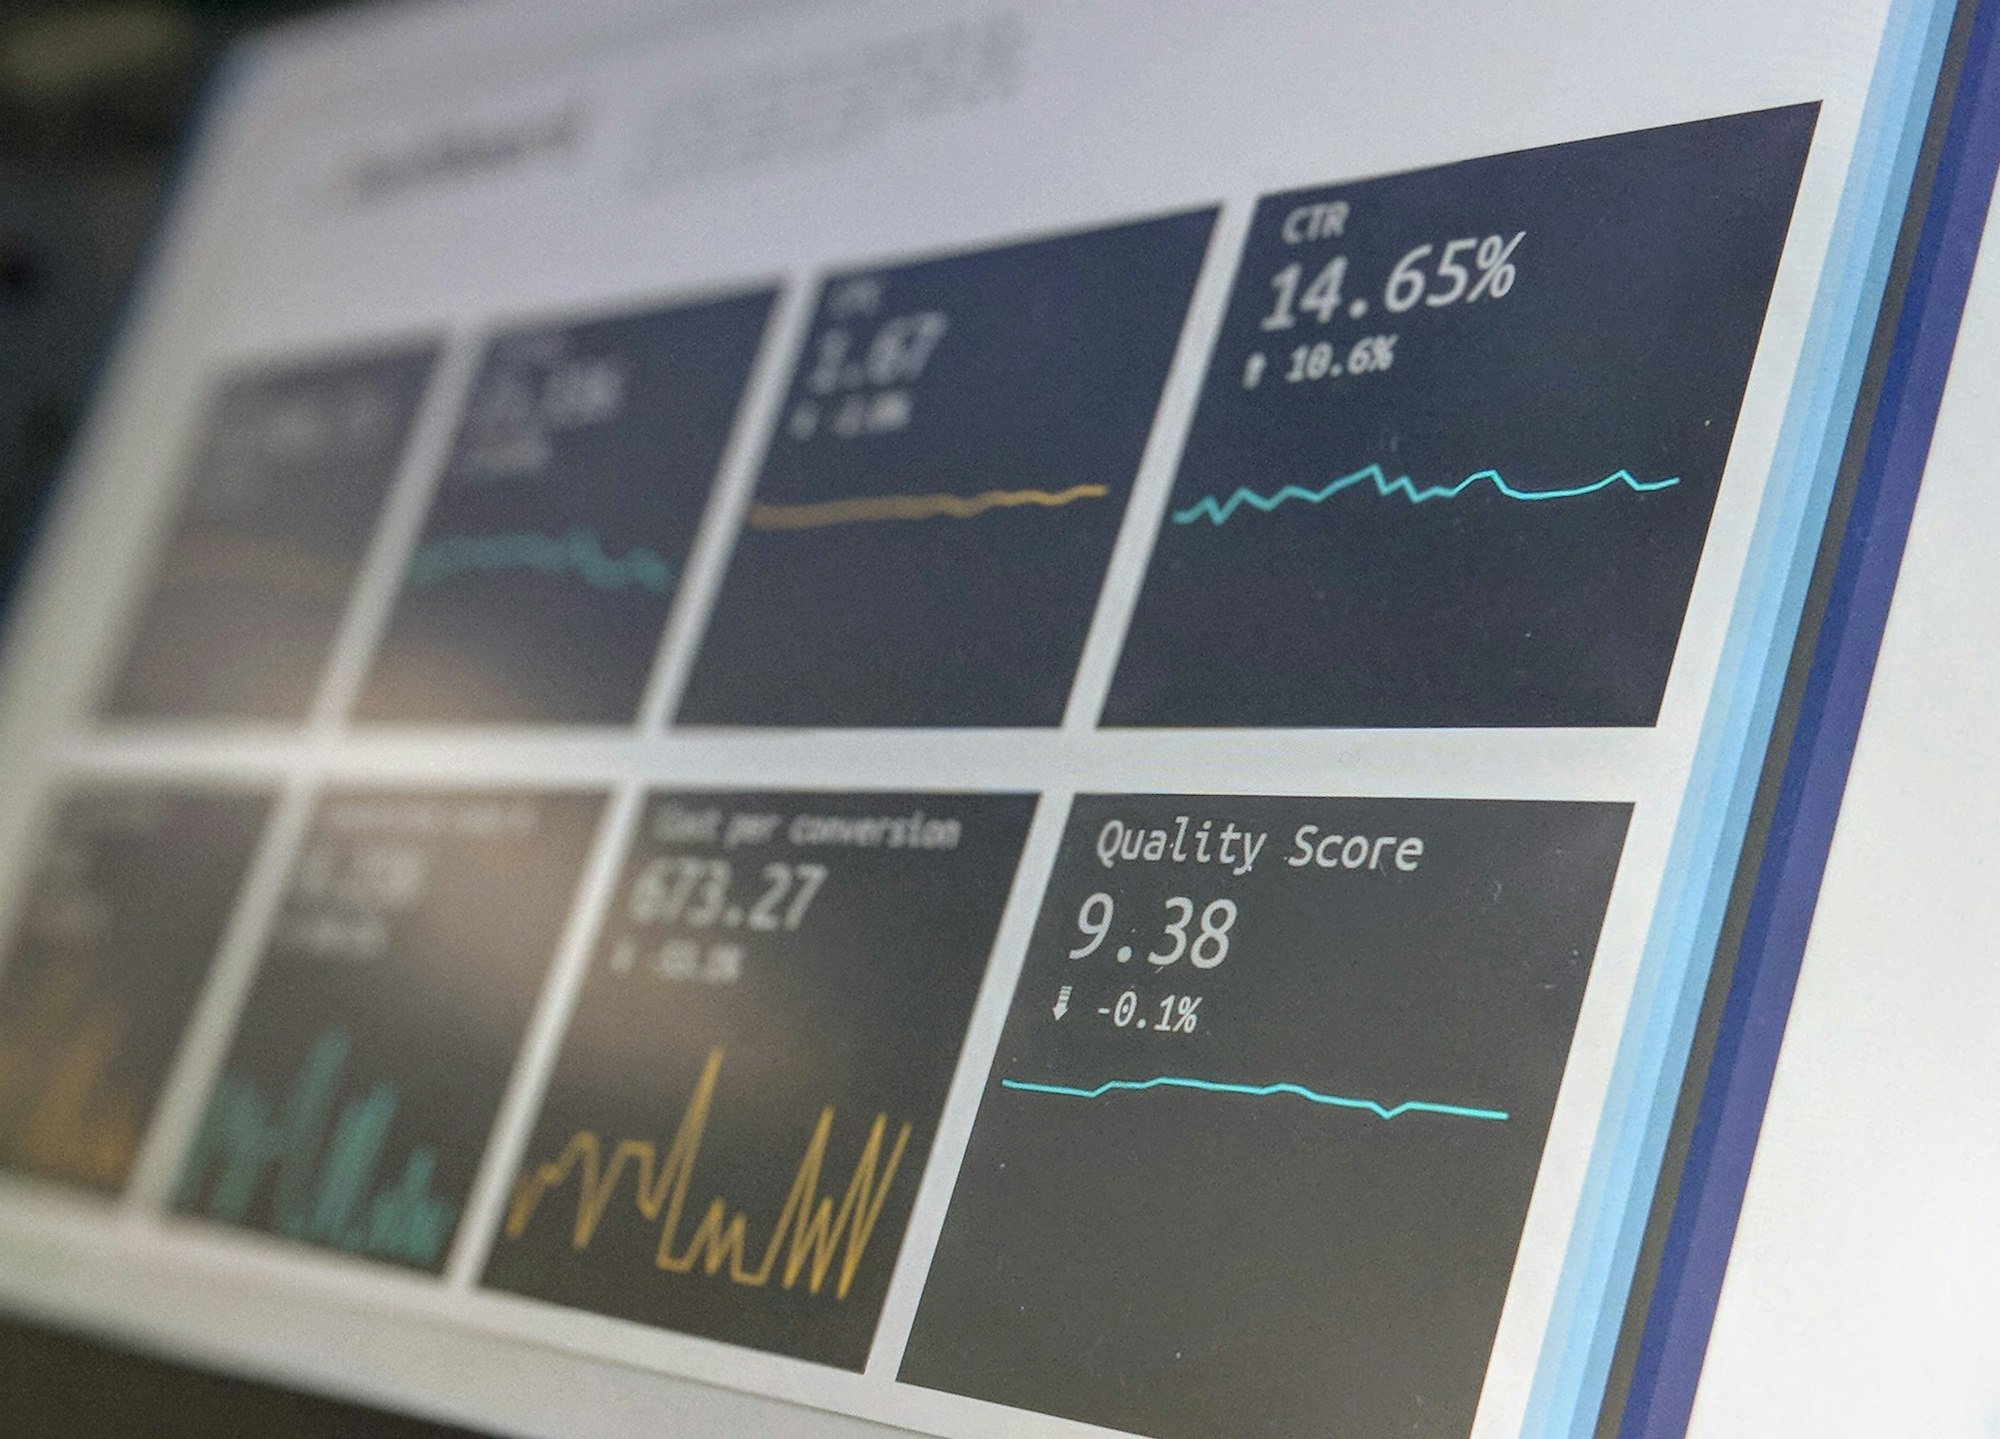
A dashboard is a visual representation of data that provides an overview of key metrics and trends. By presenting data in an easy-to-understand format, a dashboard can help you quickly identify areas that need attention and make data-driven decisions. Additionally, by using open-source technology, you can easily customize your dashboard to suit your specific needs.

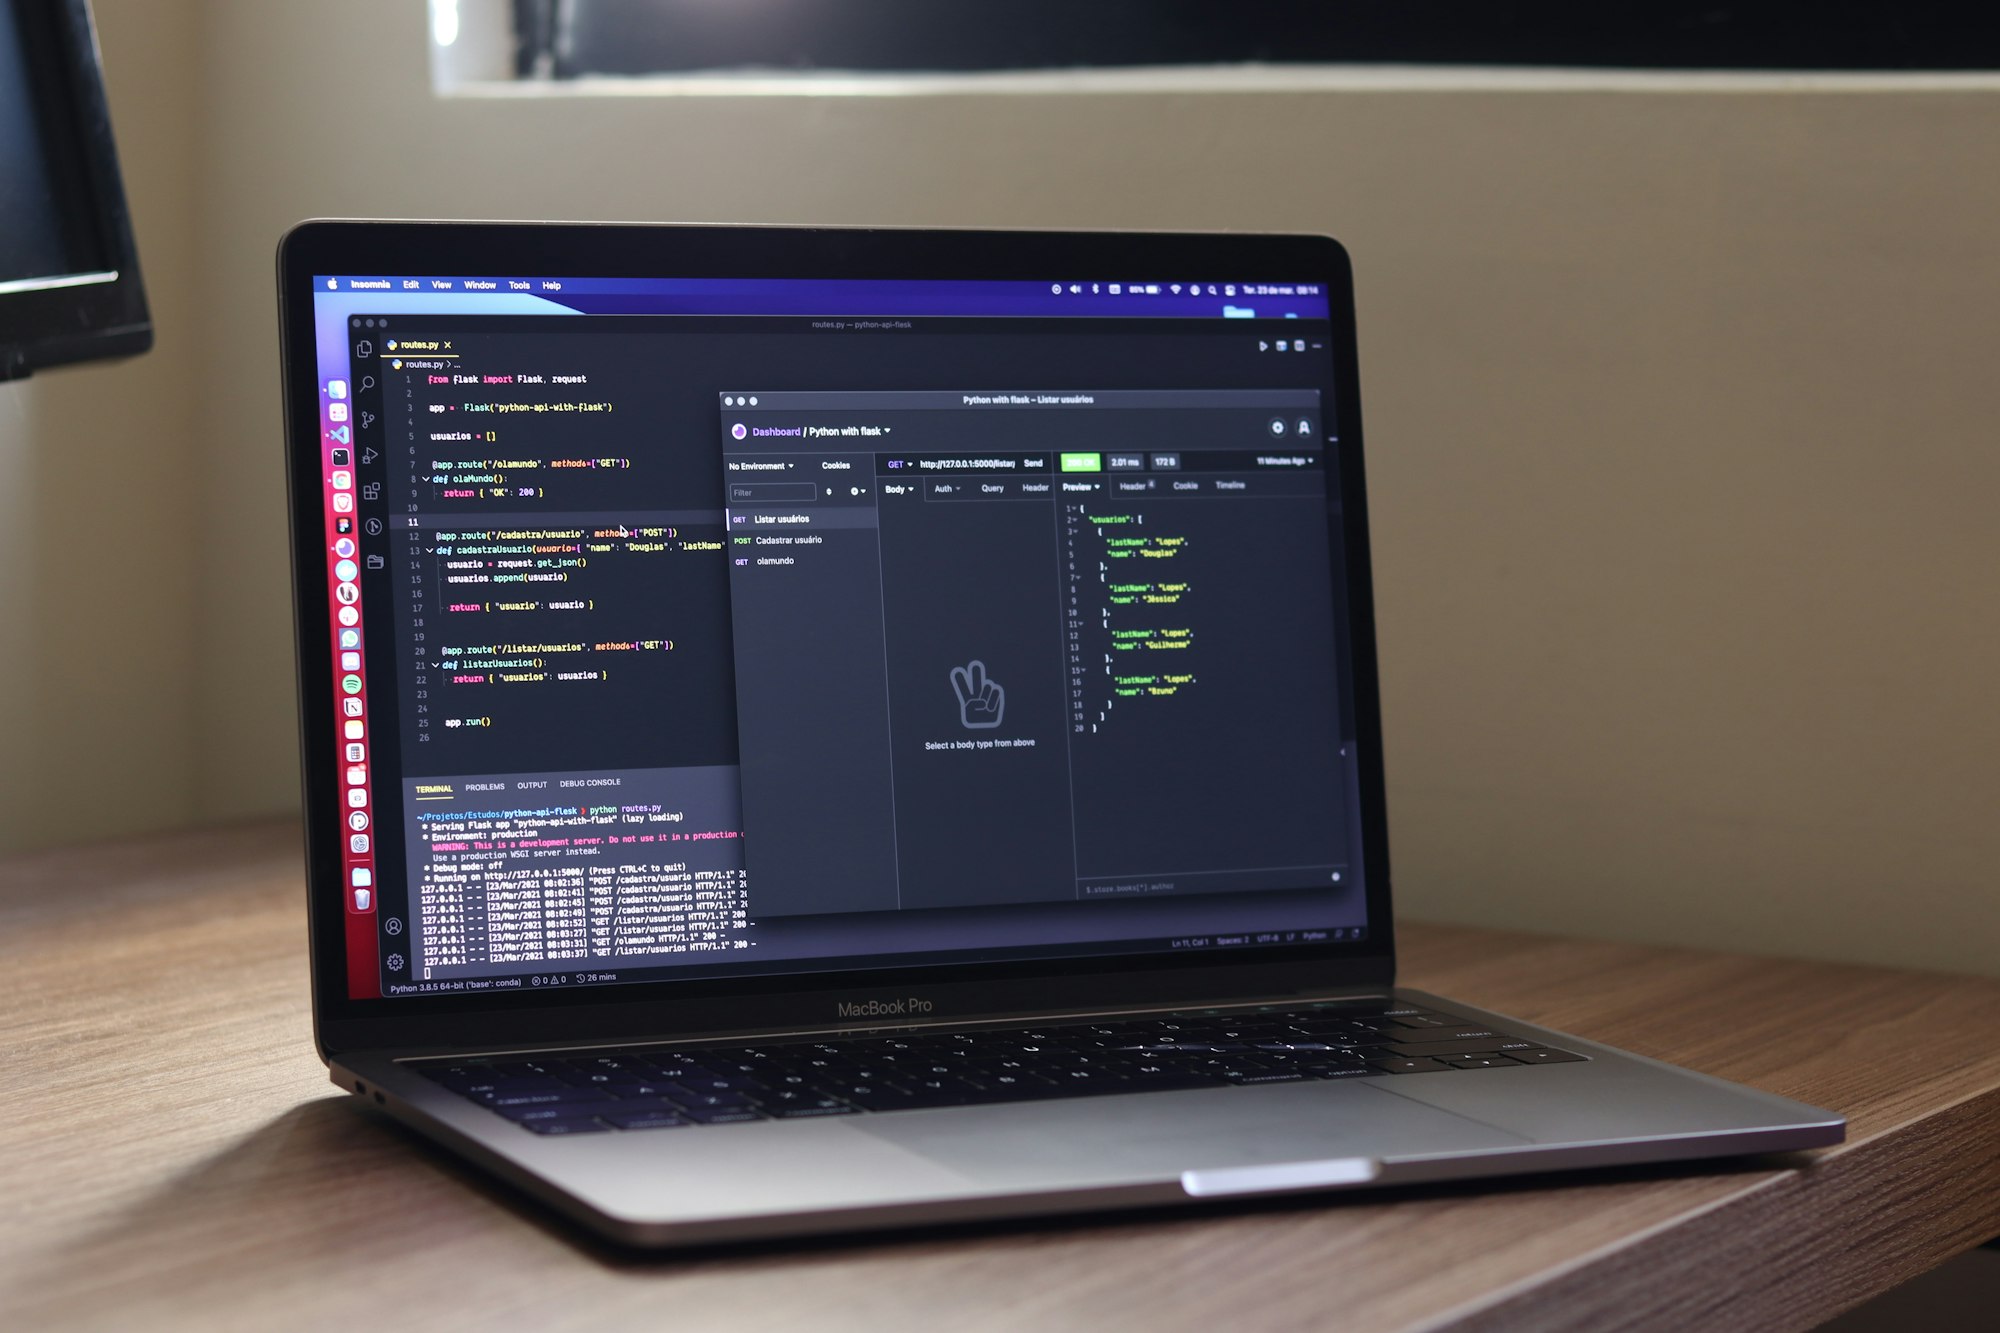
One open-source technology that is gaining popularity in the data sciences industry is Shiny, a web application framework for R. Shiny makes it easy to build interactive dashboards with R, allowing you to visualize and explore your data in real-time. With Shiny, you can create custom widgets and plots, add interactive elements like sliders and drop-down menus, and even integrate with other data sources.
Another open-source technology that can help you reign in your data is Apache Superset, a modern, enterprise-ready business intelligence web application. With Superset, you can easily create charts, dashboards, and data exploration workflows. Superset also includes a wide range of data connectors, allowing you to easily connect to your existing data sources.
Finally, Grafana is another open-source dashboard and visualization platform that is popular in the data sciences industry. Grafana provides a user-friendly interface for building and sharing dashboards, and includes support for a wide range of data sources, including databases, cloud services, and APIs.
In conclusion, if you're an economist working in the data sciences industry, a dashboard can be an invaluable tool for making sense of your data. By using open-source technologies like Shiny, Apache Superset, and Grafana, you can easily create custom dashboards that provide insights into key metrics and trends. With the right dashboard, you can stay on top of your data and make informed decisions that drive business success.